GOverlay is a monitoring solution for hardware and software. It is based on the software of the same name and optionally on external USB screens for displaying the data. In the standard GOverlay can already handle many common sensors and can be extended by further tools via plugin.
The problem
As a user of a custom water cooling system, not only the temperatures of the processor and graphics card are crucial in my PC, but I am also interested in the water temperature and the performance data of the pump. This data is provided by the Aquasuite software, which also configures the pump and fan control.
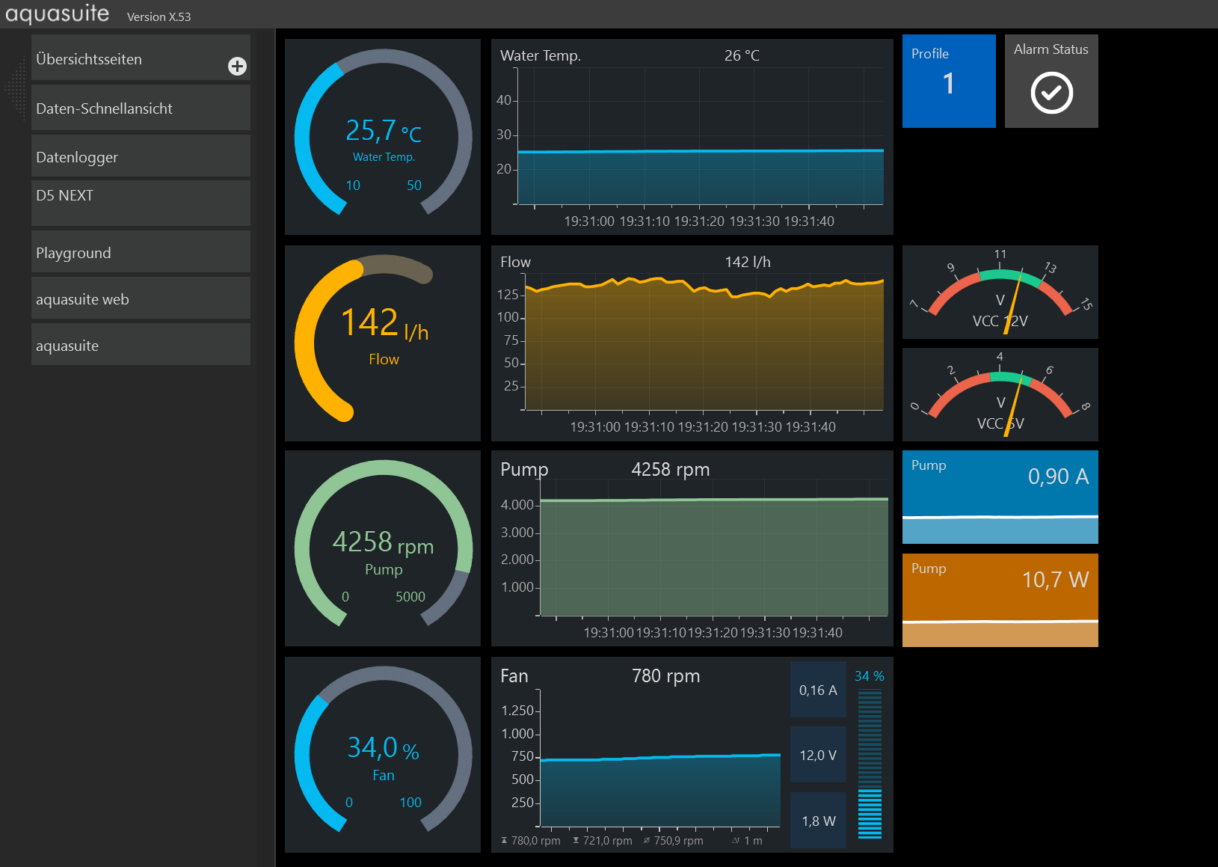
Here, fortunately, there is already a GOverlay plugin to import the sensor data exported from Aquasuite into GOverlay. However, as so often in IT, it fails because of the simple problem of formatting. Aquasuite generates the data with a dot as decimal separator, GOverlay adapts to the computer’s scheme and uses the comma as decimal separator, which is common in German-speaking countries. Unfortunately, this means that hardly any formatting options can be used in GOverlay and the display suffers enormously (especially when using graphical elements).
The solution
Fortunately, the GOverlay plugin structure is designed to be very simple and we can use the existing Aquasuite plugin as a template to customize or create a new plugin for our circumstances. Of course, this works not only for Aquasuite, but for any software that can provide this kind of data.
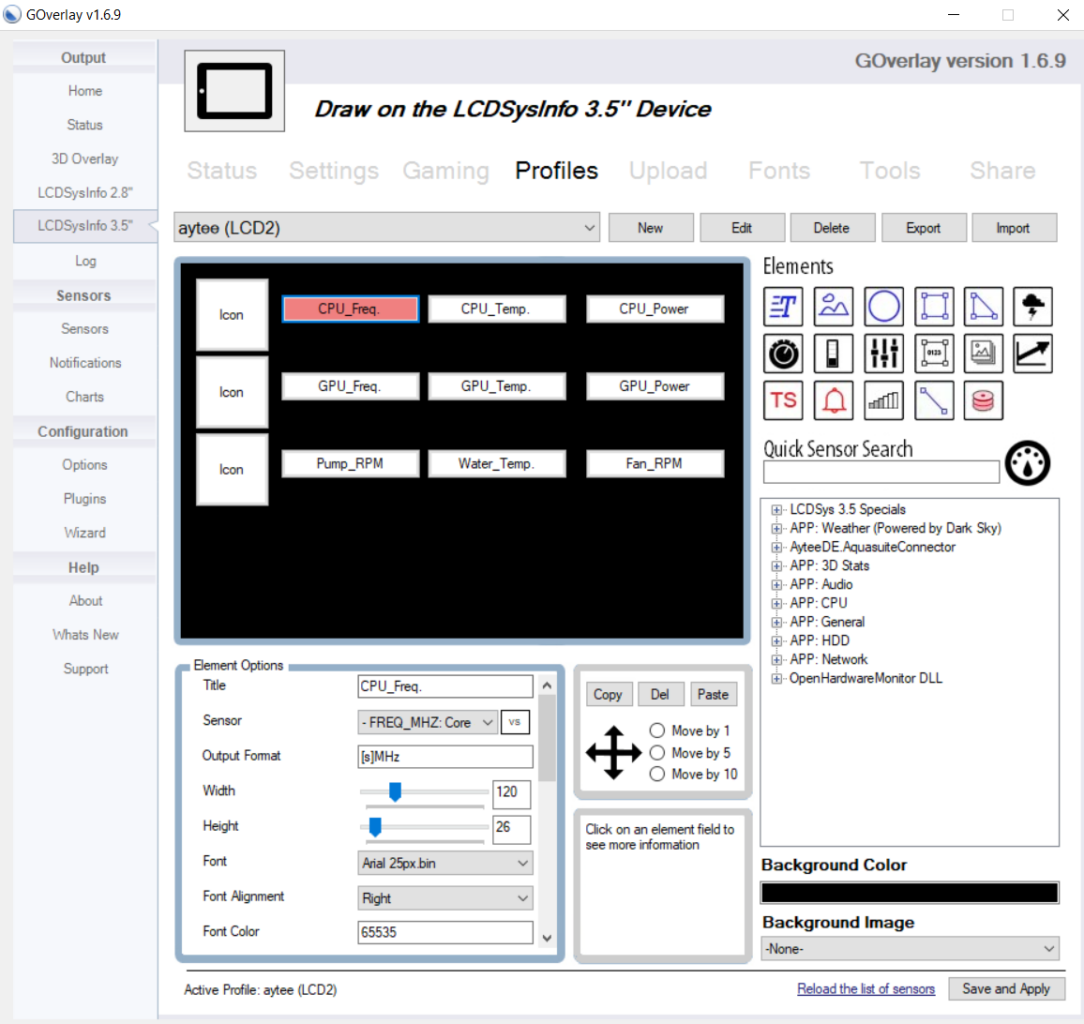
I use the following values in my GOverlay profile:
- CPU frequency
- GPU frequency
- CPU temperature
- GPU temperature
- Water temperature
- Pump speed
- Fan speed (in percent)
- CPU power consumption
- GPU power consumption
The Aquasuite export automatically groups these values so that we get values of type FREQ_MHZ, TEMPERATURE_C, WATT and DATA_SPEED_MB_S. Depending on the sensors selected in Aquasuite, these types can of course differ. Using these types, we define in the example how the display should be done. I have chosen an integer representation for all values except temperatures (TEMPERATURE_C) and transfer speeds (DATA_SPEED_MB_S).
The plugin template is a Visual Studio project, so we need Visual Studio to edit and compile it. The community version is free and quite sufficient for these purposes. With Visual Studio we can open the .sln file directly to edit the project.
In the Class1.vb class we find the two functions (AvailableSensors and GrabData) that we need to modify for our customizations.
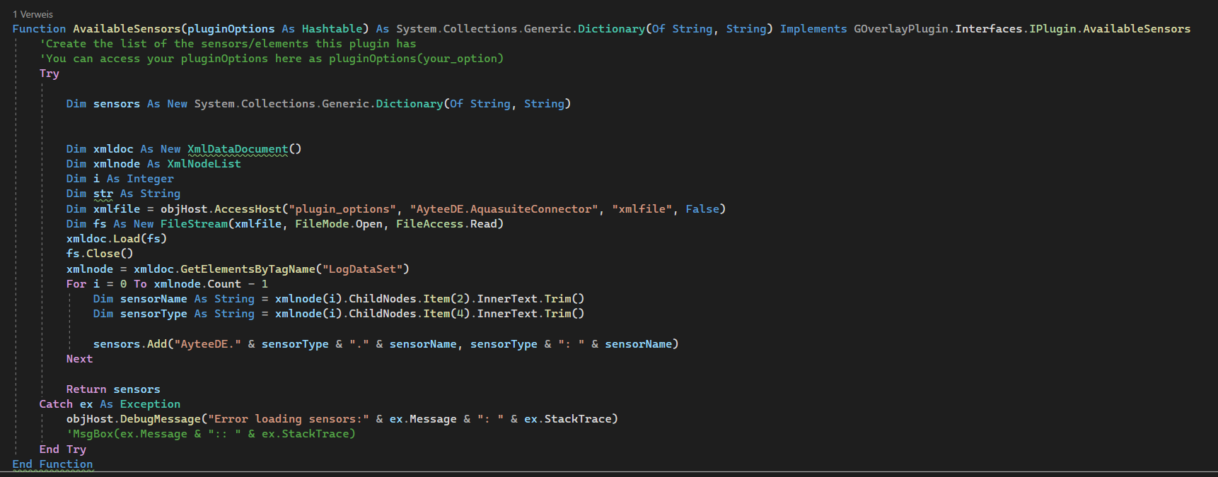
In the AvailableSensors function, when GOverlay is started (and when the sensors are updated), the available sensors are read from the XML file. So here we only need to name the sensors to access the values later.
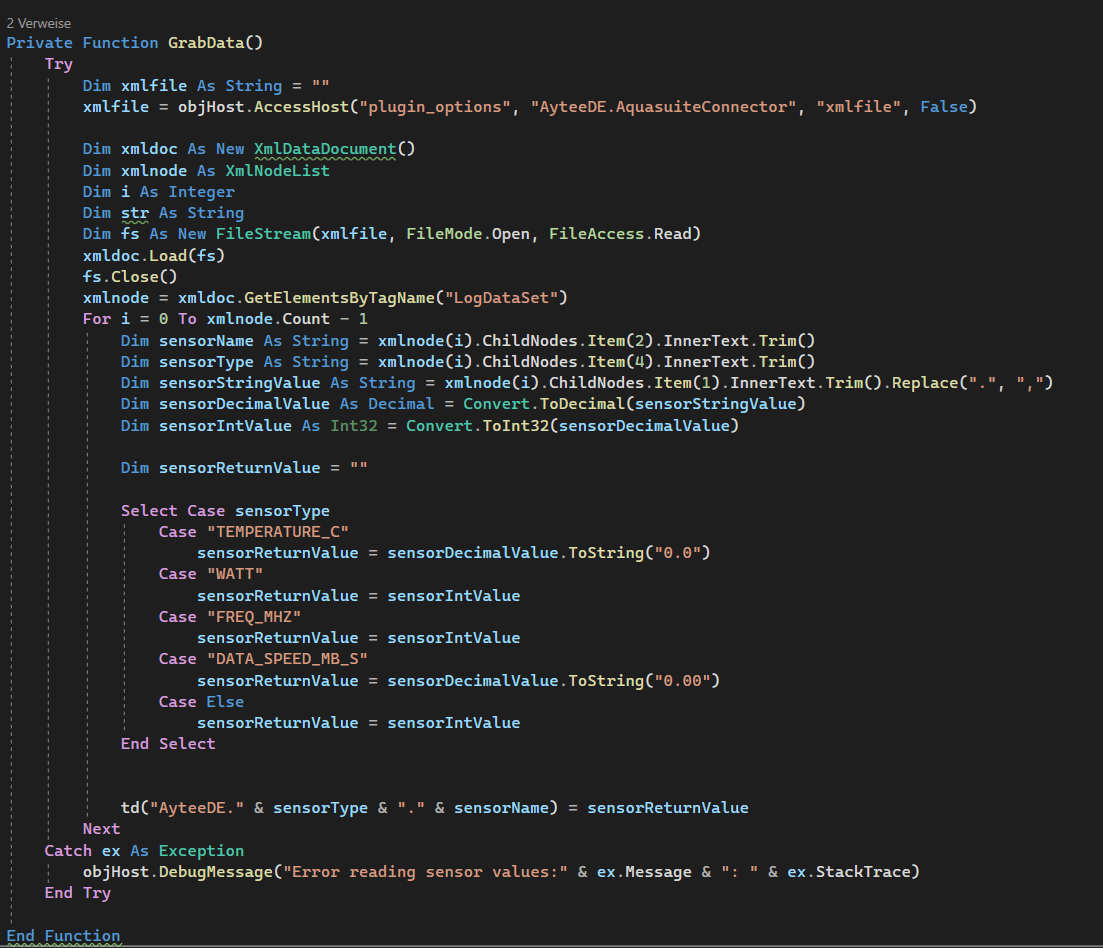
The actual reading process takes place in the GrabData function. In order to facilitate processing, we store the sensor names, types and values in separate variables. Since the return value is a string, we create an extra variable for this, which we then fill with the correct sensor name and the correctly formatted value depending on the sensor type and write to the hashtable (td).
When we create the project, a .dll file is created in the bin directory, which we deposit in the plugin directory of GOverlay. After restarting GOverlay, the plugin will be recognized and we only have to store the path of the Aquasuite XML file in the settings to be able to use the sensor values.
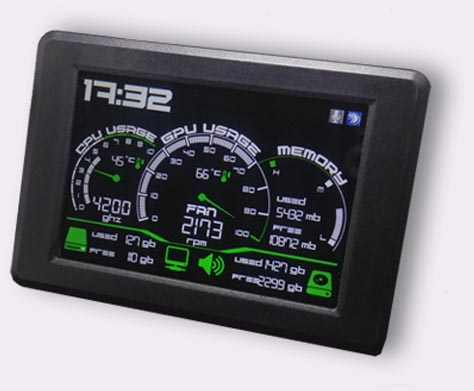
The result then looks like this:
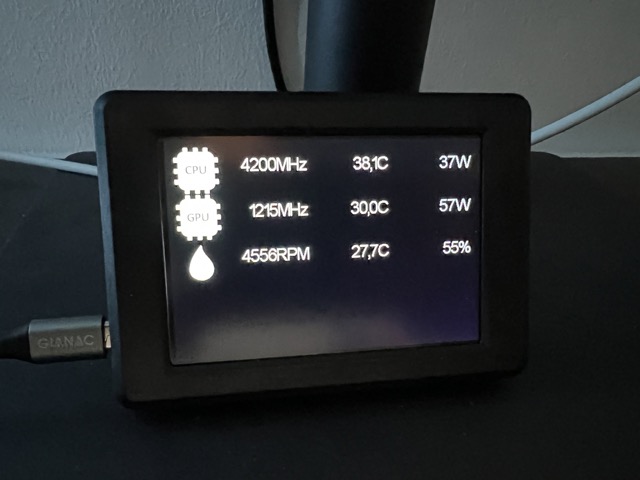
Thus, the data can be displayed cleanly and also a use of the non-text display in GOverlay such as tacho display or percentage values are possible.
Download
Download “GOverlay Aquasuite Plugin”
Aytee_GOVerlay_Connector.zip – Downloaded 3825 times – 155.93 KB